

An evergreen explainer for Indian retail readers. Last updated 24 October 2026.
Disclaimer: This article is for educational purposes only. It is not investment advice and not a recommendation to buy, sell or hold any security or derivative. HorizonDesk is not a SEBI-registered investment adviser or research analyst. Every number in the worked examples below is a hypothetical example, not real market data. Trading, particularly intraday and in futures and options, carries a high risk of loss. Please consult a SEBI-registered investment adviser before acting on any strategy.
Moving averages are the most widely used tool in technical analysis, and they sit underneath many other indicators. A "50-day average" or a "200-DMA" is mentioned constantly in market commentary. This explainer covers how the simple moving average (SMA) and exponential moving average (EMA) differ, why 20, 50 and 200 periods are popular, what golden crosses and death crosses are, how crossover strategies work, and why lag and whipsaws are the price you pay for smoothness.
What a moving average does
A moving average smooths out day-to-day noise by averaging a fixed number of recent prices, usually closing prices. As each new bar arrives, the oldest one drops out, so the average "moves" along the chart. StockCharts ChartSchool describes moving averages as lagging, trend-following indicators: they are built from past prices, so they describe a trend rather than predict one.
A rising average says prices have generally been rising over that window; a falling one says the opposite. The direction of a long average is often used as a simple definition of the longer-term trend.
SMA vs EMA
Simple moving average (SMA)
The SMA is the plain average: add the last n closes and divide by n. Every close in the window has equal weight, and a close leaves the average completely once it is n bars old.
Exponential moving average (EMA)
The EMA gives more weight to recent closes. Its multiplier is 2 ÷ (n + 1), and each update is new EMA = (close − previous EMA) × multiplier + previous EMA. The first value is usually seeded with an SMA. ChartSchool gives the examples of an 18.18% weight for a 10-period EMA and 9.52% for a 20-period EMA. Because each value depends on all earlier ones, platforms that use different amounts of history can show slightly different EMA values.
ChartSchool's summary is that EMAs have less lag and turn before SMAs, while SMAs represent a true average of the period and may suit support and resistance work better. Neither is "better"; they answer slightly different questions.
Worked example (hypothetical numbers)
Example only. These are imaginary closing prices for an imaginary stock, chosen for easy arithmetic. They are not real market data.
Twelve daily closes: 100, 102, 101, 103, 104, 106, 108, 107, 110, 112, 108, 105. We use a 5-day SMA and a 5-day EMA, whose multiplier is 2 ÷ (5 + 1) = 1/3. The first EMA (day 5) is seeded with the first SMA.
| Day | Close | 5-day SMA | 5-day EMA calculation | 5-day EMA |
|---|---|---|---|---|
| 5 | 104 | (100+102+101+103+104) ÷ 5 = 102.0 | Seed = SMA | 102.00 |
| 6 | 106 | 103.2 | (106 − 102.00) ÷ 3 + 102.00 | 103.33 |
| 7 | 108 | 104.4 | (108 − 103.33) ÷ 3 + 103.33 | 104.89 |
| 8 | 107 | 105.6 | (107 − 104.89) ÷ 3 + 104.89 | 105.59 |
| 9 | 110 | 107.0 | (110 − 105.59) ÷ 3 + 105.59 | 107.06 |
| 10 | 112 | 108.6 | (112 − 107.06) ÷ 3 + 107.06 | 108.71 |
| 11 | 108 | 109.0 | (108 − 108.71) ÷ 3 + 108.71 | 108.47 |
| 12 | 105 | 108.4 | (105 − 108.47) ÷ 3 + 108.47 | 107.31 |
During the rally (days 6 to 10) the EMA mostly sits at or just above the SMA, closer to price; day 8 is close to a tie (105.59 vs 105.6). On day 11, price falls to 108. The EMA turns down immediately (108.71 to 108.47), but the SMA still rises to 109.0, because the close leaving the window (day 6's 106) was lower than the new close. The SMA only turns down on day 12. That one-day difference is lag in miniature: an SMA's movement depends both on the new close and on the old one being dropped.
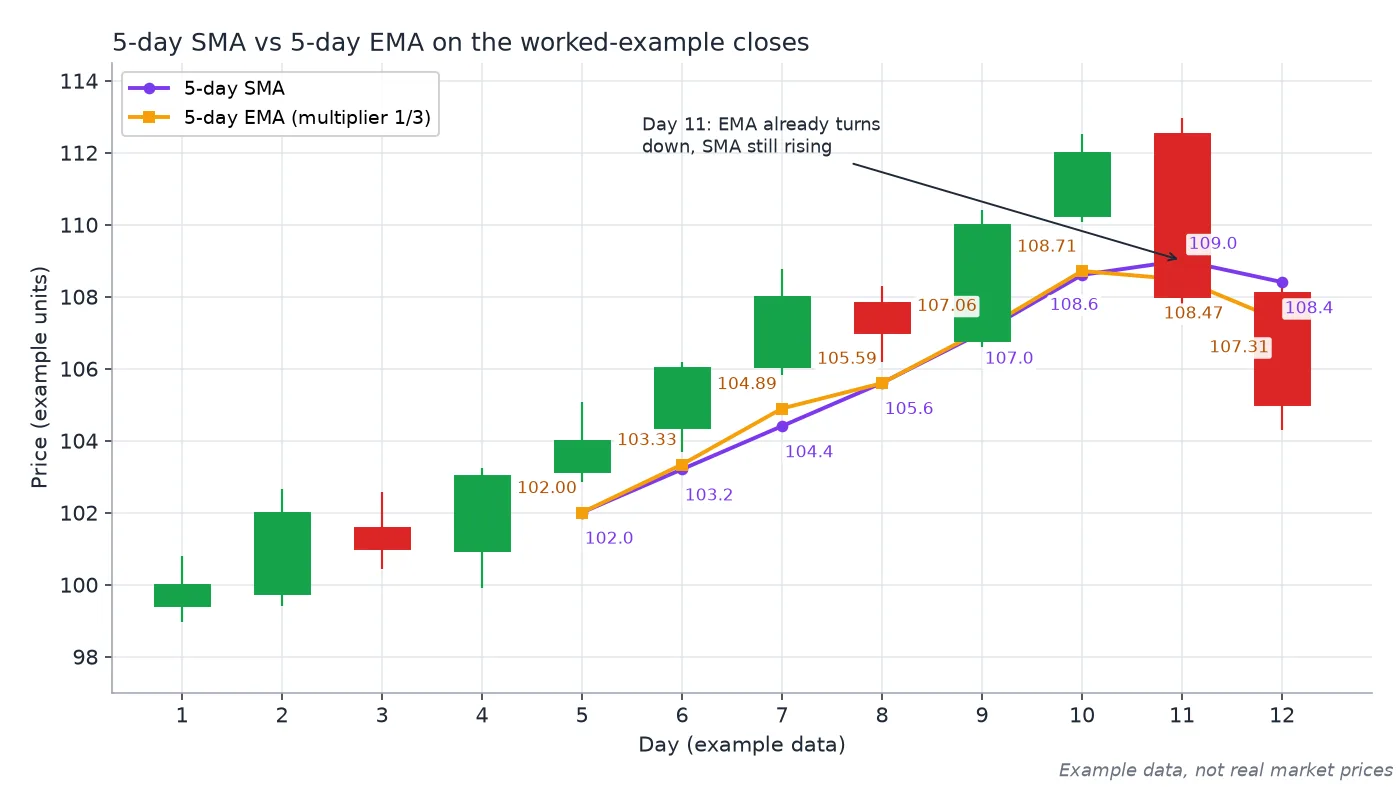
Chart 1: the worked example. Both averages start at 102 on day 5. The EMA tracks the rally more closely and turns down on day 11 (108.71 to 108.47), while the SMA still rises to 109.0 before dipping on day 12. Example data, not real market prices.
Common periods: 20, 50 and 200
ChartSchool groups lengths roughly as follows: 5 to 20 periods for short-term trends, 20 to 60 for medium-term, and 100 or more for long-term. Within that:
- 20-period: a common short-term average, roughly a month of trading days. It is also the middle line of Bollinger Bands, which use a 20-period SMA by default.
- 50-day: described by ChartSchool as quite popular for the medium-term trend.
- 200-day: perhaps the most popular long-term average. Market commentary often refers to an index trading above or below its "200-DMA".
There is nothing special about these numbers; they are popular largely by convention. Partly because so many people watch them, price reactions around them get noticed, but no level is a guaranteed support or resistance.
Golden cross and death cross
A golden cross occurs when a shorter moving average crosses above a longer one; the best-known version is the 50-day crossing above the 200-day. A death cross is the reverse: the shorter average crossing below the longer one. ChartSchool notes the death cross is sometimes called a "dead cross", and Investopedia describes the golden cross as a bullish signal and the death cross as a bearish one.
Both are slow by design. A 200-day average needs a long, sustained move to turn, so by the time a cross happens, much of the move is usually already in the price.
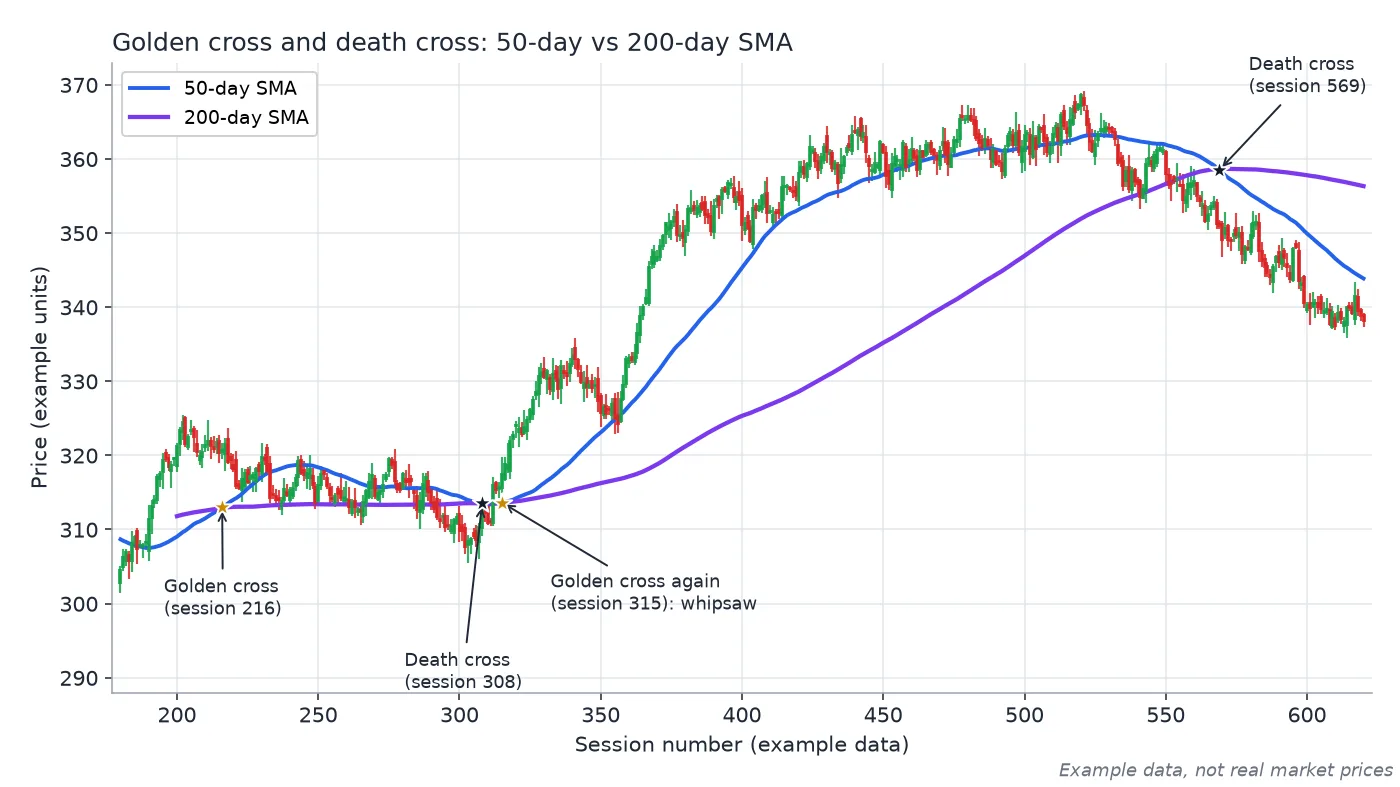
Chart 2: golden and death crosses on synthetic data. The death cross at session 308 reverses into a golden cross seven sessions later (a whipsaw), and the death cross at session 569 arrives 49 sessions after the price peak. Example data, not real market prices.
Chart 2 shows both sides. The death cross at session 308 (close 312.82) is followed by a golden cross only seven sessions later at a higher close of 317.47, so anyone acting on the first signal would have sold low and bought back higher. Later, price peaks at 368.61 around session 520, but the death cross does not arrive until session 569, when the close is 350.94, about 4.8% below the peak.
Crossover strategies
Moving-average crossovers come in two common forms:
- Price crossover: price closing above or below a single moving average, for example the 50-day.
- Double crossover: a short average crossing a long one. ChartSchool cites John Murphy's term "double crossover method" and gives examples: a 5-day and 35-day EMA pair would be short-term, while a 50-day and 200-day SMA pair would be medium- to long-term.
The shorter the averages, the more signals you get, and the more of them are false. Some traders add filters, such as requiring a close beyond the average for two or three sessions, or only taking crossovers in the direction of a longer average. MACD is itself built from the gap between a 12-period and 26-period EMA, so its zero-line crossover is an EMA crossover in another form. Trailing-stop tools such as the Supertrend indicator take a different route to the same goal of following a trend.
Limits: lag and whipsaws
- Lag. Every moving average reports what has already happened. ChartSchool describes them as identifying trend reversals as they occur at best, or after they occur at worst.
- Whipsaws. In sideways markets, price and the averages keep crossing, producing a string of small losing signals, as in Chart 2 around sessions 308 to 315.
- No single right period. A setting that worked on one stock or period may fail on another. Optimising periods on past data can produce results that do not repeat.
- Gaps and events. Results, policy decisions and global news can move price far beyond any average in a single session.
- No fundamentals. A stock above its 200-day average can still be overvalued or have a weakening business.
Risk matters more than signals. SEBI's September 2024 study found that 93% of individual equity F&O traders made losses between FY22 and FY24. A crossover rule does not change those odds without careful position sizing and risk control.
Key takeaways
- An SMA weights every close equally; an EMA uses a 2 ÷ (n + 1) multiplier to weight recent closes more and turns sooner.
- 20, 50 and 200 are popular conventions for short-, medium- and long-term trend views, not magic levels.
- Golden and death crosses (typically 50-day vs 200-day) are slow, and can whipsaw in sideways markets.
- Moving averages describe trends; they do not forecast them.
Related reading on HorizonDesk
- MACD explained: 12/26 EMAs, signal line, histogram and divergence
- Bollinger Bands explained: the squeeze, band walks and limits
- RSI explained: how the Relative Strength Index works, 70/30 levels and divergence
Sources
- StockCharts ChartSchool: Moving Averages, Simple and Exponential
- Investopedia: Simple Moving Average (SMA)
- Investopedia: Exponential Moving Average (EMA)
- Investopedia: Golden Cross
- Investopedia: Death Cross
- NSE: NCFM Technical Analysis Module
- SEBI press release (23 Sep 2024): 93% of individual F&O traders incurred losses, FY22–FY24
- SEBI Investor Website (investor education)