
An evergreen explainer for Indian retail readers. Last updated 24 October 2026.
Disclaimer: This article is for educational purposes only. It is not investment advice and not a recommendation to buy, sell or hold any security or derivative. HorizonDesk is not a SEBI-registered investment adviser or research analyst. Every number in the worked examples below is a hypothetical example, not real market data. Trading, particularly intraday and in futures and options, carries a high risk of loss. Please consult a SEBI-registered investment adviser before acting on any strategy.
Supertrend is one of the most widely used chart indicators among Indian retail traders, partly because it is so simple to read: a single line that sits below price when the trend is up and above price when the trend is down, usually coloured green or red. Behind that simple line is a volatility measure called the Average True Range (ATR). This explainer covers how Supertrend is built, what its two settings do, how its "flips" work, why many traders use it as a trailing stop-loss, and where it tends to fail.
What Supertrend is
Supertrend is a trend-following overlay drawn directly on the price chart. Its creation is commonly attributed to French trader Olivier Seban, though the exact origin is not well documented. The indicator places a band a fixed number of ATRs away from the middle of each bar. As long as price closes on the "right" side of that band, the trend reading stays the same. When price closes through it, the indicator flips to the other side and changes colour.
Because the distance is based on ATR, the band automatically sits further from price when the market is volatile and closer when it is calm. That is the main difference between Supertrend and a fixed-percentage or fixed-point stop.
The building block: Average True Range
ATR was introduced by J. Welles Wilder Jr. in his 1978 book New Concepts in Technical Trading Systems. It measures how much an instrument typically moves in one bar, including gaps. First you compute the true range (TR) for each bar, which is the largest of:
- today's high minus today's low;
- the absolute value of today's high minus yesterday's close;
- the absolute value of today's low minus yesterday's close.
ATR is then a smoothed average of TR over a chosen number of periods. Wilder's method seeds the first value with a simple average and then uses: ATR today = (previous ATR × (n − 1) + today's TR) ÷ n.
How Supertrend is calculated
For each bar, take the midpoint of the high and low, often written as (H + L) ÷ 2. Then:
- Basic upper band = (H + L) ÷ 2 + multiplier × ATR
- Basic lower band = (H + L) ÷ 2 − multiplier × ATR
These basic bands are then "ratcheted" into final bands:
- In an uptrend, the final lower band can only stay flat or move up. If today's basic lower band is lower than yesterday's final lower band, yesterday's value is kept.
- In a downtrend, the final upper band can only stay flat or move down.
The Supertrend line is the final lower band while the trend is up, and the final upper band while the trend is down. A close below the lower band flips the trend to down; a close above the upper band flips it to up.
Period and multiplier: what the two settings do
Supertrend has two inputs. Settings of a 10-period ATR with a multiplier of 3 are widely quoted, and some platforms default to 7 and 3; check your own app, because defaults vary.
The ATR period
The period controls how many bars go into the ATR. A shorter period makes ATR react quickly to a sudden burst of volatility; a longer period makes it steadier. On its own, the period changes the band distance less than the multiplier does.
The multiplier
The multiplier decides how many ATRs away from the midpoint the band sits. This is the main sensitivity dial:
- A lower multiplier (for example 1.5 or 2) keeps the line close to price. It flips sooner, which means earlier signals but many more false ones.
- A higher multiplier (for example 3 or 4) gives price more room. It flips less often and stays with a trend longer, but gives back more of the move before it turns.
There is no "correct" setting. Any setting that looks perfect on a past chart may simply be fitted to that chart; this is a common trap known as curve fitting.
Worked example (hypothetical numbers)
Example only. The table below uses an imaginary stock and assumed ATR values, not real market data. Settings: multiplier 3. The stock starts in an uptrend.
| Day | High | Low | Close | ATR (assumed) | (H+L)/2 | Basic lower | Basic upper | Supertrend | Trend |
|---|---|---|---|---|---|---|---|---|---|
| 1 | 210 | 200 | 208 | 4.0 | 205.0 | 193.0 | 217.0 | 193.0 | Up |
| 2 | 214 | 206 | 213 | 4.1 | 210.0 | 197.7 | 222.3 | 197.7 | Up |
| 3 | 216 | 209 | 210 | 4.2 | 212.5 | 199.9 | 225.1 | 199.9 | Up |
| 4 | 211 | 203 | 205 | 4.4 | 207.0 | 193.8 | 220.2 | 199.9 | Up |
| 5 | 204 | 196 | 198 | 4.6 | 200.0 | 186.2 | 213.8 | 213.8 | Down |
Walking through it:
- Day 1: midpoint 205, minus 3 × 4.0 = 193. The line sits at 193, below price.
- Days 2–3: the basic lower band rises to 197.7 and then 199.9, so the line ratchets up with price.
- Day 4: the basic lower band falls to 193.8, but the ratchet rule keeps the line at 199.9. The close of 205 is still above it, so the trend stays up.
- Day 5: the close of 198 is below 199.9. The indicator flips to a downtrend, and the line jumps above price to the upper band, 200 + 3 × 4.6 = 213.8.
Notice what the flip cost in this example: the stock closed at 213 on Day 2 but the flip only came on a close of 198. Supertrend never catches the top or the bottom; it confirms a change only after a meaningful move against the trend.
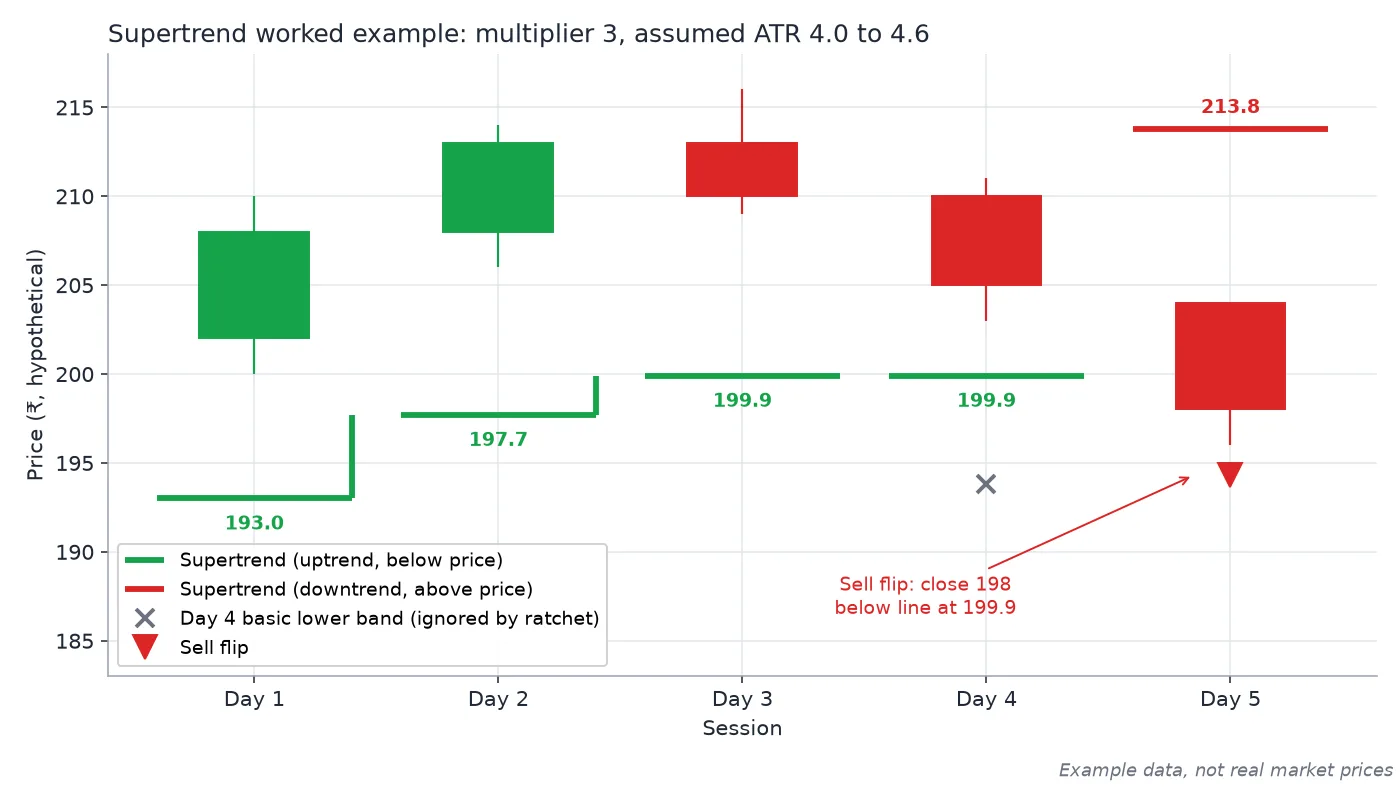
The worked example above as a chart: the green line ratchets up under price, ignores Day 4's lower basic band, and flips red above price after the Day 5 close of 198. Example data, not real market prices.
Buy and sell flips: how traders read them
The colour change is often described as a "buy signal" (red to green) or a "sell signal" (green to red). It is more accurate to call it a change in the indicator's trend reading. Points to keep in mind:
- Most implementations judge the flip on the closing price. On an intraday chart, the line can appear to flip mid-candle and then un-flip before the candle closes.
- Many traders look for confirmation from something else, such as a higher-timeframe trend, volume, or a momentum oscillator, before treating a flip as meaningful.
- Results on one timeframe say little about another. A 5-minute Supertrend on an index can flip many times in a session while the daily Supertrend does not change.
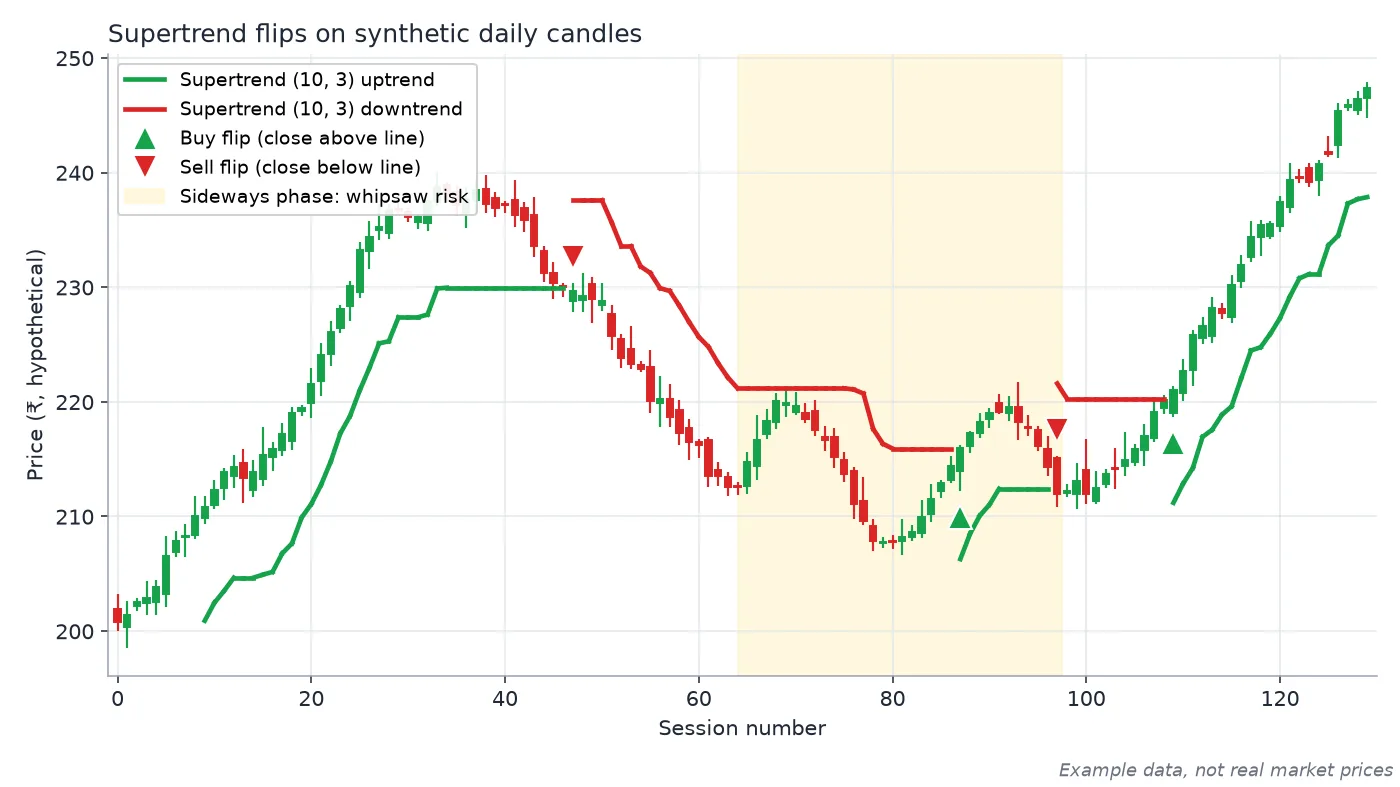
Supertrend (10, 3) on synthetic daily candles: green below price in uptrends, red above in downtrends, with triangles at each flip. The shaded sideways phase shows how back-to-back flips (whipsaws) appear when there is no clear trend. Example data, not real market prices.
Using Supertrend as a trailing stop
A popular use is not as an entry signal at all, but as a trailing stop-loss for a position someone already holds. Because the lower band only ratchets up during an uptrend, it behaves much like the Chandelier Exit described by StockCharts: an ATR-based exit that follows price higher and never loosens.
- For a long position, the idea is to exit if price closes below the Supertrend line.
- For a short position, the mirror rule applies with the upper band.
- Because the stop moves with volatility, it tends to avoid being knocked out by ordinary noise better than a very tight fixed stop. The trade-off is that it can sit quite far from price after a big move.
A stop is only a plan. In a sharp gap down, price can open well below the line, and the actual exit can be much worse than the line suggested.
Limits: why Supertrend struggles in sideways markets
Supertrend works best when a market trends cleanly. Its main weakness is a sideways or choppy market:
- Whipsaws. In a range, price repeatedly closes on either side of the line, producing a string of flips that each lose a little. Costs such as brokerage, STT and slippage add up quickly.
- Lag. By design it reacts after a move. Entries come late and exits give back part of the gain.
- Setting sensitivity. Small changes to the period or multiplier can change the trade history a lot, which makes back-tests fragile.
The risk is real. A SEBI study published in September 2024 found that 93% of more than one crore individual equity F&O traders made losses between FY22 and FY24, with average losses of around ₹2 lakh per trader including transaction costs. No single indicator changes those odds on its own.
Key takeaways
- Supertrend = midpoint ± multiplier × ATR, with a ratchet so the line only tightens in the direction of the trend. Platforms may smooth ATR differently, so lines can vary slightly between apps.
- The multiplier is the main sensitivity dial; lower settings flip more often.
- Flips confirm a change after it has started; they do not predict tops or bottoms.
- It is often more useful as a volatility-aware trailing stop than as a standalone signal.
Related reading on HorizonDesk
- Building your first investment portfolio: a beginner's framework
- Common online scams in India and how to spot them, including stock-tip and trading-group frauds
- Market wrap: Sensex and Nifty's weekly fall on crude and FII selling
Sources
- Investopedia: Supertrend indicator
- Investopedia: Average True Range (ATR)
- StockCharts ChartSchool: Average True Range (ATR)
- StockCharts ChartSchool: Chandelier Exit
- NSE: NCFM Technical Analysis Module
- SEBI press release (23 Sep 2024): 93% of individual F&O traders incurred losses, FY22–FY24
- SEBI Investor Website (investor education)