
An evergreen explainer for Indian retail readers. Last updated 24 October 2026.
Disclaimer: This article is for educational purposes only. It is not investment advice and not a recommendation to buy, sell or hold any security or derivative. HorizonDesk is not a SEBI-registered investment adviser or research analyst. Every number in the worked examples below is a hypothetical example, not real market data. Trading, particularly intraday and in futures and options, carries a high risk of loss. Please consult a SEBI-registered investment adviser before acting on any strategy.
MACD, short for Moving Average Convergence/Divergence, appears in the indicator list of almost every Indian trading app. It takes two exponential moving averages of price and turns the gap between them into a momentum reading, with a signal line and a histogram on top. This explainer covers what each of the three parts means, how the standard 12, 26, 9 settings are calculated, the three common ways traders read it (signal-line crossovers, zero-line crossovers and divergence), and where it tends to mislead.
What MACD is
According to StockCharts ChartSchool, MACD was developed by Gerald Appel in the late 1970s. It subtracts a slower moving average from a faster one, which turns two trend-following tools into a momentum oscillator. When the two averages move apart, MACD moves away from zero; when they move together, it shrinks back toward zero. That is the "convergence" and "divergence" in the name.
If moving averages are new to you, our explainer on SMA vs EMA, golden crosses and death crosses covers the building blocks.
The three parts: MACD line, signal line and histogram
- MACD line = 12-period EMA of closing prices − 26-period EMA of closing prices.
- Signal line = 9-period EMA of the MACD line.
- Histogram = MACD line − signal line. It is positive when MACD is above its signal line and negative when it is below. ChartSchool credits Thomas Aspray with developing the MACD-Histogram, as a way to anticipate signal-line crossovers.
The 12, 26, 9 values are the standard defaults, but platforms let you change them. On a daily chart the periods are days; on a 15-minute chart they are 15-minute bars.
How an EMA is updated
An exponential moving average gives more weight to recent closes. Each new value uses a multiplier of 2 ÷ (periods + 1):
- 12-period EMA: 2 ÷ 13 ≈ 0.1538
- 26-period EMA: 2 ÷ 27 ≈ 0.0741
- 9-period signal line: 2 ÷ 10 = 0.2
The update rule is new EMA = (today's close − yesterday's EMA) × multiplier + yesterday's EMA. The first EMA value is usually seeded with a simple average, so platforms that start from different amounts of history can show slightly different MACD numbers.
Worked example (hypothetical numbers)
Example only. The numbers below come from an imaginary price series built for this article. They are not real market data and do not describe any stock or index.
At the end of session 43 the example series has: 12-period EMA = 444.64, 26-period EMA = 451.97, so MACD = −7.32; the signal line is −7.17. MACD is below its signal line, so the histogram is negative. Session 44 closes at 441.49.
| Step | Calculation | Result |
|---|---|---|
| New 12-period EMA | (441.49 − 444.64) × 0.1538 + 444.64 | 444.16 |
| New 26-period EMA | (441.49 − 451.97) × 0.0741 + 451.97 | 451.19 |
| MACD line | 444.16 − 451.19 | −7.03 |
| Signal line | (−7.03 − (−7.17)) × 0.2 + (−7.17) | −7.14 |
| Histogram | −7.03 − (−7.14) | +0.11 |
The histogram has flipped from negative to positive, which means the MACD line has crossed above its signal line: a bullish signal-line crossover. Notice three things. First, MACD is still deep below zero, so the 12-period EMA remains well under the 26-period EMA; the crossover says downside momentum is easing, not that a trend has turned. Second, MACD rose because the 26-period EMA fell further (0.78 points) than the 12-period EMA (0.48 points): the close sat much further below the slower average, even though that average has the smaller multiplier. Third, the margin is tiny, and one weak close could flip it back.
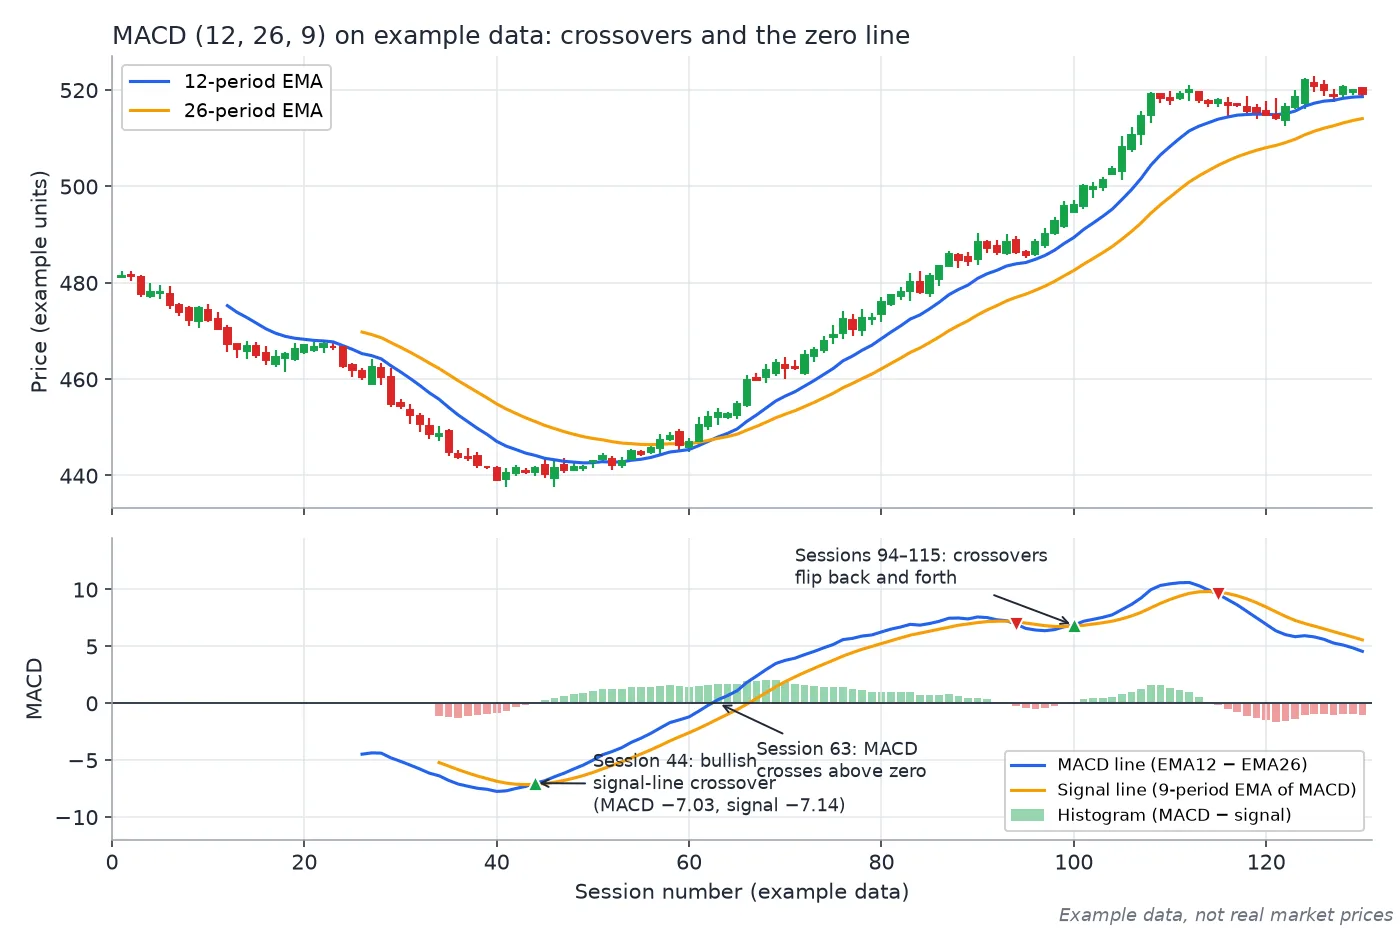
Chart 1: the worked example in context. The bullish signal-line crossover at session 44 (MACD −7.03, signal −7.14) happens below zero; MACD crosses above zero at session 63, and crossovers flip back and forth between sessions 94 and 115. Example data, not real market prices.
Reading MACD: three common signals
1. Signal-line crossovers
ChartSchool describes these as the most common MACD signals. A bullish crossover occurs when MACD turns up and crosses above the signal line; a bearish crossover occurs when it turns down and crosses below. On the histogram, this is the moment bars change from negative to positive or the other way round. ChartSchool also advises caution with crossovers at positive or negative extremes, and notes that volatile prices produce more crossovers. In Chart 1, the crossovers between sessions 94 and 115 flip back and forth while price keeps drifting higher, which is a typical whipsaw.
2. Zero-line (centerline) crossovers
When MACD moves above zero, the 12-period EMA has crossed above the 26-period EMA; below zero means the opposite. Positive MACD that keeps rising means upside momentum is increasing. These crossovers come later than signal-line crossovers but tend to reflect a broader shift. In Chart 1, MACD turns positive at session 63, roughly 19 sessions after the bullish signal-line crossover.
3. Divergence
A bearish divergence forms when price makes a higher high but MACD makes a lower high. A bullish divergence is a lower low in price with a higher low in MACD. Both suggest momentum is not confirming the price move. ChartSchool says divergences should be taken with caution: bearish divergences are commonplace in strong uptrends and bullish divergences in strong downtrends, because a trend can continue at a slower pace after its initial burst of momentum.
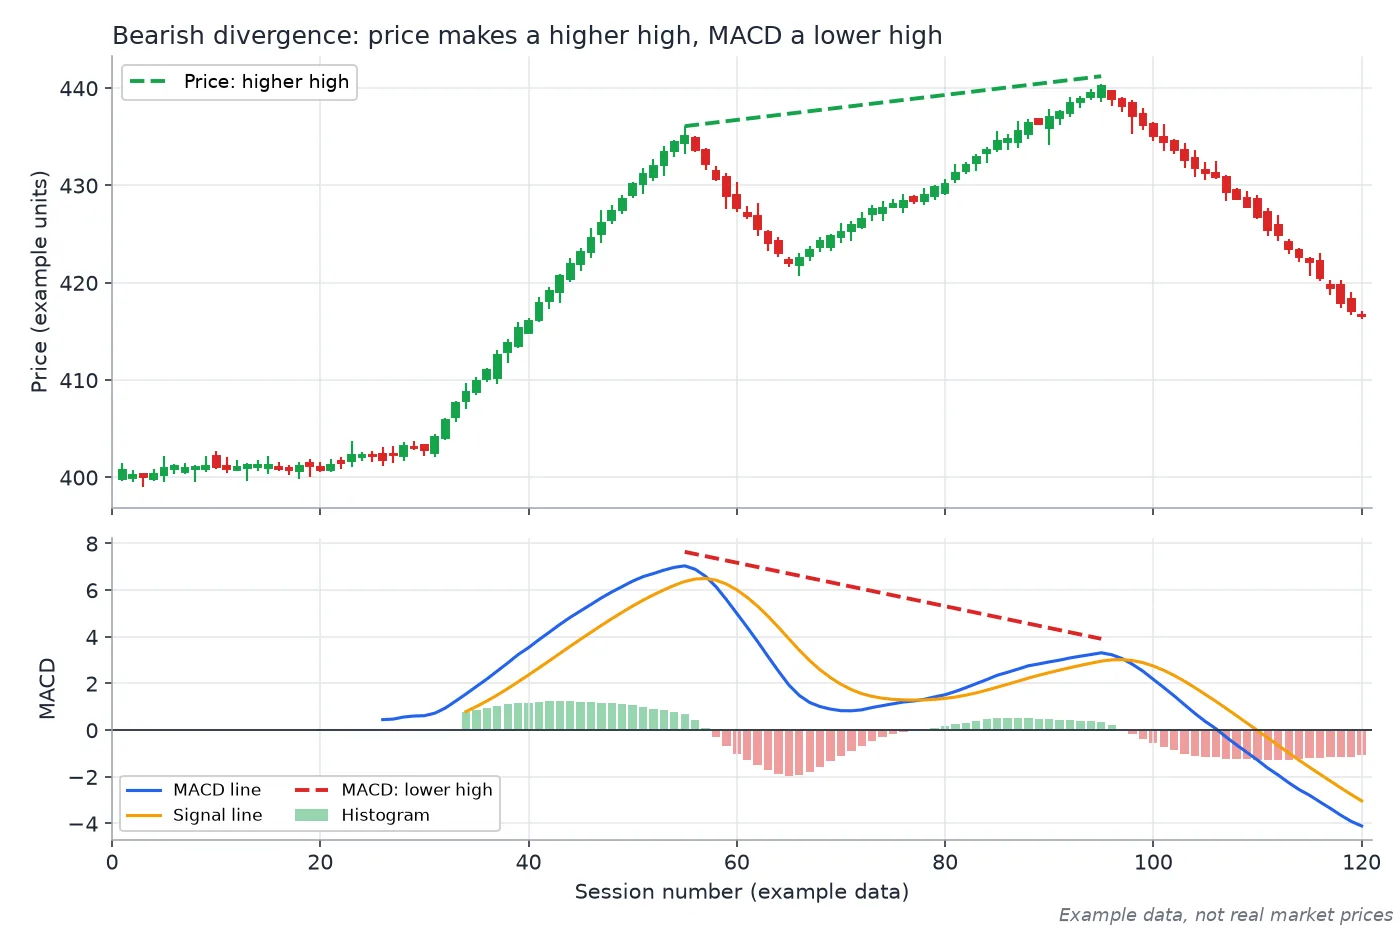
Chart 2: bearish divergence. Price peaks at 435.08 (session 55) and then at a higher 440.21 (session 95), but MACD peaks lower, about 7.04 then 3.31. Example data, not real market prices.
In Chart 2, the first rally is fast, so the 12-period EMA pulls far above the 26-period EMA and MACD peaks around 7. The second rally to a higher price is slower, so the gap between the two EMAs, and therefore MACD, peaks only around 3.3. MACD measures the speed of the move, not the price level. A bearish divergence of this kind is a warning, not a timing tool.
MACD alongside other tools
MACD has no fixed upper or lower bounds, which is why ChartSchool says it is not particularly useful for spotting overbought and oversold levels. Traders who want those zones usually look at a bounded oscillator such as the Relative Strength Index (RSI). Volatility tools like Bollinger Bands add context on how stretched price is, and a trailing trend tool like the Supertrend indicator is sometimes used to filter MACD crossovers so that only those in the direction of the prevailing trend are considered. Combining indicators can reduce noise, but several lagging indicators agreeing is not independent confirmation; they are all built from the same past prices.
Limits of MACD
- It lags. MACD is made of moving averages, and the signal line is an average of an average. Crossovers usually arrive after a move has already started.
- Whipsaws in sideways markets. When price chops in a range, the EMAs stay close together and MACD flips across its signal line and zero repeatedly.
- Unbounded, scale-dependent values. MACD is measured in price points, so a reading of 7 means different things on a ₹100 stock and a ₹10,000 index. ChartSchool notes that MACD values cannot be compared across securities with different prices and suggests the Percentage Price Oscillator (PPO) for such comparisons.
- Settings change everything. Faster settings give more, earlier and noisier signals; slower ones give fewer, later signals. Results from one setting do not transfer to another.
- Gaps and news. Results, policy decisions and global events can move price sharply before any moving average reacts.
- No fundamentals. MACD knows nothing about earnings, valuation or debt.
The broader context matters as well. SEBI's September 2024 study found that 93% of individual equity F&O traders made losses between FY22 and FY24. An indicator crossover does not change those odds on its own; position sizing and risk control matter more.
Key takeaways
- MACD line = 12-period EMA − 26-period EMA; signal line = 9-period EMA of MACD; histogram = MACD − signal.
- Signal-line crossovers are the earliest and noisiest signals; zero-line crossovers are slower and reflect the EMAs themselves crossing.
- Divergence shows fading momentum but can fail repeatedly in strong trends.
- MACD is unbounded and lags, so it is best treated as context alongside price, trend and risk management.
Related reading on HorizonDesk
- Moving averages explained: SMA vs EMA, 20/50/200 and the golden cross
- RSI explained: how the Relative Strength Index works, 70/30 levels and divergence
- Supertrend indicator explained: ATR, period, multiplier and trailing stops
Sources
- StockCharts ChartSchool: MACD (Moving Average Convergence/Divergence) Oscillator
- StockCharts ChartSchool: MACD-Histogram
- Investopedia: What is MACD?
- Investopedia: Exponential Moving Average (EMA)
- NSE: NCFM Technical Analysis Module
- SEBI press release (23 Sep 2024): 93% of individual F&O traders incurred losses, FY22–FY24
- SEBI Investor Website (investor education)