

An evergreen explainer for Indian retail readers. Last updated 24 October 2026.
Disclaimer: This article is for educational purposes only. It is not investment advice and not a recommendation to buy, sell or hold any security or derivative. HorizonDesk is not a SEBI-registered investment adviser or research analyst. Every number in the worked examples below is a hypothetical example, not real market data. Trading, particularly intraday and in futures and options, carries a high risk of loss. Please consult a SEBI-registered investment adviser before acting on any strategy.
The Relative Strength Index, or RSI, is probably the best-known momentum oscillator on Indian trading apps. It turns recent price changes into a single number between 0 and 100, and readings above 70 or below 30 are often described as "overbought" or "oversold". Those labels are easy to misuse. This explainer covers how RSI is calculated, what the 70/30 levels really mean, how divergence works, and where the indicator tends to mislead.
What RSI measures
RSI was developed by J. Welles Wilder Jr. and introduced in his 1978 book New Concepts in Technical Trading Systems, the same book that introduced the Average True Range. RSI compares the size of recent up-moves with the size of recent down-moves. It does not measure price level, value or the strength of a company; despite the similar name, it is also different from "relative strength" comparisons between a stock and an index.
Think of it as a speedometer for price. A high reading says recent gains have been much larger than recent losses. A low reading says the opposite. It says nothing about where price "should" go next.
How RSI is calculated
Wilder's default look-back is 14 periods, and that remains the standard setting on most platforms. The steps are:
- For each bar, calculate the change from the previous close.
- Split the changes into gains (positive changes; losses count as zero) and losses (the size of negative changes; gains count as zero).
- The first average gain is the sum of gains over 14 periods divided by 14. The first average loss is calculated the same way.
- After that, Wilder smoothing is used: average gain = (previous average gain × 13 + current gain) ÷ 14, and the same for losses.
- RS = average gain ÷ average loss.
- RSI = 100 − 100 ÷ (1 + RS).
If there are no losses at all over the period, RSI is 100; if there are no gains, it is 0. Because of the smoothing, RSI values depend slightly on how much history a platform uses, so two apps can show marginally different numbers.
Worked example (hypothetical numbers)
Example only. These are imaginary closing prices for an imaginary stock, chosen to keep the arithmetic easy. They are not real market data.
Fifteen closes give fourteen changes: +1.5, −0.7, +1.4, +0.8, −0.6, +1.4, +0.7, −0.4, +1.1, +0.8, −0.7, +1.1, +0.7, −0.5 (starting at 100.0 and ending at 106.6).
| Step | Calculation | Result |
|---|---|---|
| Sum of gains | 1.5 + 1.4 + 0.8 + 1.4 + 0.7 + 1.1 + 0.8 + 1.1 + 0.7 | 9.5 |
| Sum of losses | 0.7 + 0.6 + 0.4 + 0.7 + 0.5 | 2.9 |
| First average gain | 9.5 ÷ 14 | 0.6786 |
| First average loss | 2.9 ÷ 14 | 0.2071 |
| RS | 0.6786 ÷ 0.2071 | 3.276 |
| RSI | 100 − 100 ÷ (1 + 3.276) | 76.6 |
Now apply the smoothing for the next two hypothetical days:
- Day 15, close up 1.4: average gain = (0.6786 × 13 + 1.4) ÷ 14 = 0.7301; average loss = (0.2071 × 13 + 0) ÷ 14 = 0.1923. RS = 3.796, so RSI ≈ 79.1.
- Day 16, close down 2.0: average gain = (0.7301 × 13 + 0) ÷ 14 = 0.6780; average loss = (0.1923 × 13 + 2.0) ÷ 14 = 0.3215. RS = 2.109, so RSI ≈ 67.8.
Two lessons from the example. First, a steady climb with small pullbacks can push RSI above 70 without anything dramatic happening. Second, one larger down day can drag RSI back below 70 quickly, even though price is still well above where it started.
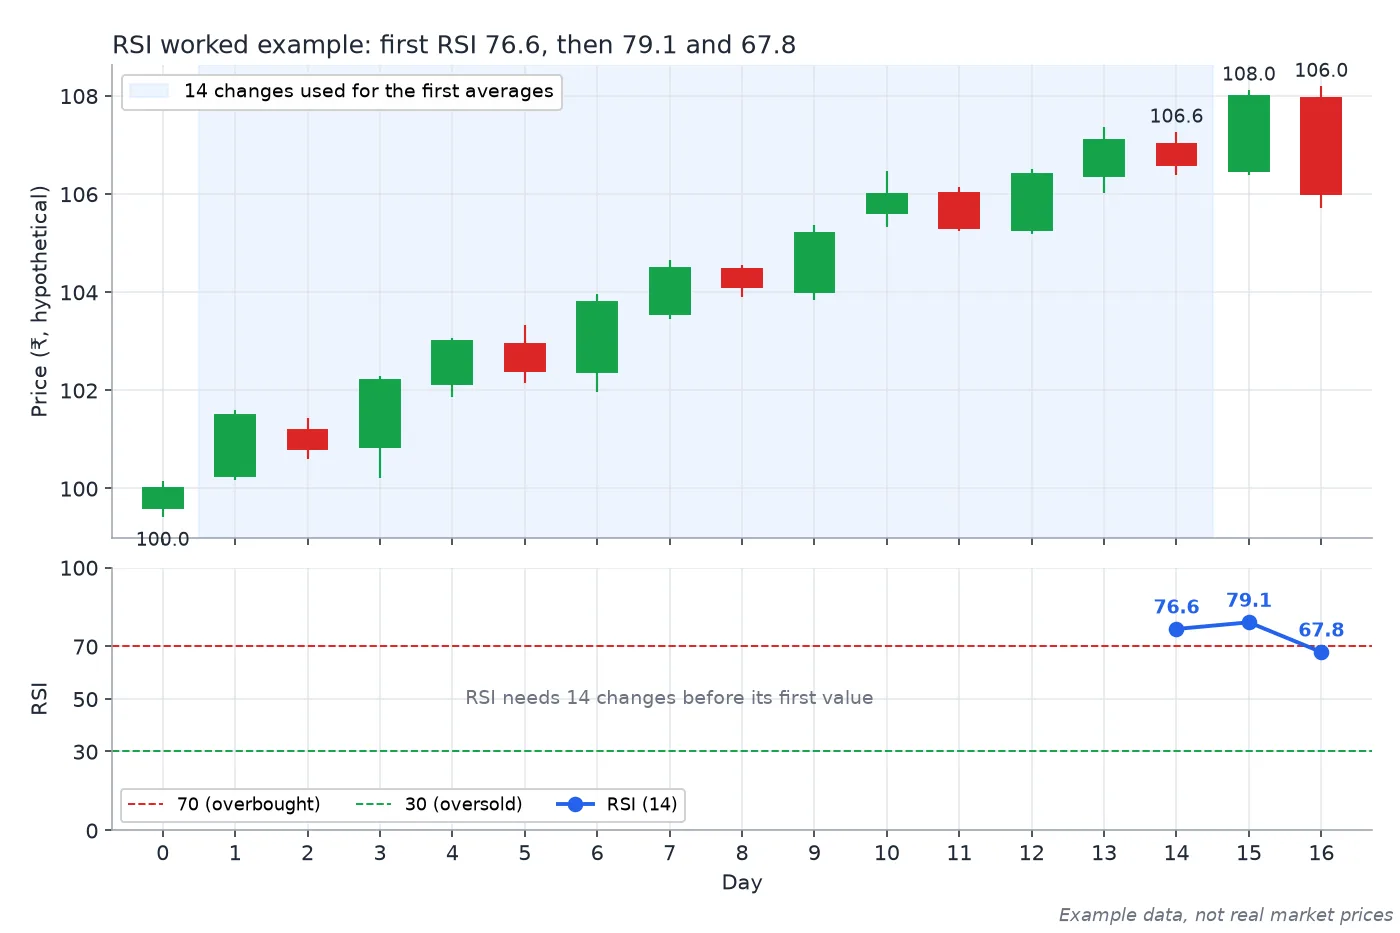
The worked example as a chart: RSI needs 14 price changes before its first value (76.6 on Day 14). It rises to 79.1 after the Day 15 gain and drops to 67.8 after the Day 16 fall. Example data, not real market prices.
The 70/30 levels: overbought and oversold
Wilder considered RSI overbought above 70 and oversold below 30. StockCharts ChartSchool notes that these readings work best when prices move sideways within a range. In a trending market they can be misleading:
- In a strong uptrend, RSI can stay above 70 for long stretches. "Overbought" here often means "strong", not "about to fall".
- In a strong downtrend, RSI can stay below 30 while price keeps sliding.
- Some traders shift the levels to 80/20 to reduce the number of signals in trending markets. Others watch the 50 line as a rough divide between bullish and bearish momentum.
A reading above 70 is not a reason to sell, and a reading below 30 is not a reason to buy. Each is simply information about recent momentum.
Divergence
Divergence happens when price and RSI disagree. According to Wilder, as summarised by StockCharts, divergence can point to a potential reversal because momentum is not confirming price.
Bullish divergence
Price makes a lower low, but RSI makes a higher low. Selling pressure is making new price lows, but with less downside momentum than before.
Bearish divergence
Price makes a higher high, but RSI makes a lower high. Price is still rising, but the up-moves are losing force.
Hypothetical illustration
Example only: an imaginary stock peaks at ₹500 with RSI at 78. A few weeks later it makes a new high at ₹512, but RSI reaches only 66. That is a bearish divergence. It suggests momentum is fading; it does not say when, or whether, price will fall.
ChartSchool's warning is worth repeating: divergences are misleading in a strong trend, and a strong uptrend can show several bearish divergences before any top forms. Many traders wait for price itself to confirm, for example by breaking a support level, rather than acting on divergence alone.
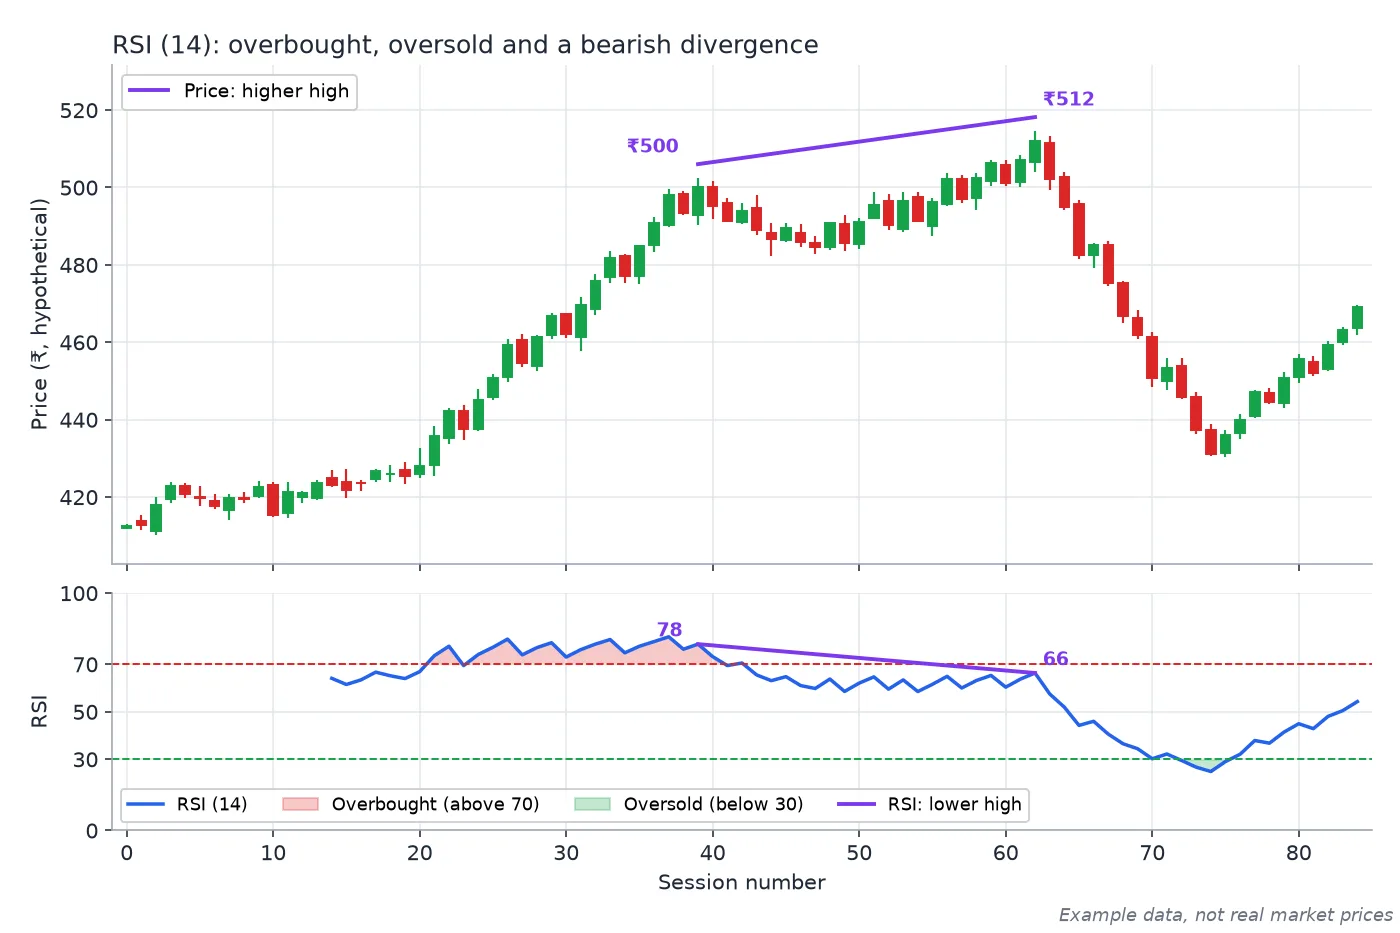
Bearish divergence on synthetic data: price makes a higher high (₹500 to ₹512) while RSI makes a lower high (78 to 66). Shading marks overbought readings above 70 and the later oversold reading below 30. Example data, not real market prices.
RSI alongside a trend tool
Because RSI is a momentum oscillator, it is often paired with a trend-following indicator. For example, a trader might only pay attention to oversold readings while a trend tool such as the ATR-based Supertrend indicator is showing an uptrend, on the idea that pullbacks within a trend are more meaningful than countertrend signals. This is a way to filter readings, not a guarantee.
Limits of RSI
- It can stay extreme. Overbought can become more overbought; this is the most common way RSI misleads new traders.
- It lags. It is built from past closes, so it describes what has happened, not what will happen.
- Settings matter. A shorter look-back (say 7) makes RSI jumpier and hits 70/30 more often; a longer one (say 21) makes it smoother. Results from one setting do not carry over to another.
- Gaps and events. Results, policy announcements and global shocks can move price far beyond what any oscillator anticipated.
- No fundamentals. RSI knows nothing about earnings, valuation or debt. A stock can be "oversold" because its business has genuinely deteriorated.
Keep the wider picture in mind too. SEBI's September 2024 study found that 93% of individual equity F&O traders made losses over FY22 to FY24. Momentum readings are not a shortcut around that risk.
Key takeaways
- RSI = 100 − 100 ÷ (1 + RS), where RS is Wilder-smoothed average gain over average loss, usually across 14 periods.
- 70/30 are reference levels, not instructions; in trends, RSI can stay extreme for a long time.
- Divergence flags fading momentum but often needs price confirmation and can fail repeatedly in strong trends.
- RSI is most informative alongside trend context and sound risk management.
Related reading on HorizonDesk
- Supertrend indicator explained: ATR, period, multiplier and trailing stops
- SIP explained for beginners, with compounding worked examples
- Common online scams in India and how to spot them, including fake trading tips
Sources
- StockCharts ChartSchool: Relative Strength Index (RSI)
- Investopedia: Relative Strength Index (RSI)
- Investopedia: Overbought or oversold? Using RSI
- NSE: NCFM Technical Analysis Module
- SEBI press release (23 Sep 2024): 93% of individual F&O traders incurred losses, FY22–FY24
- SEBI Investor Website (investor education)