
An evergreen explainer for Indian retail readers. Last updated 24 October 2026.
Disclaimer: This article is for educational purposes only. It is not investment advice and not a recommendation to buy, sell or hold any security or derivative. HorizonDesk is not a SEBI-registered investment adviser or research analyst. Every number in the worked examples below is a hypothetical example, not real market data. Trading, particularly intraday and in futures and options, carries a high risk of loss. Please consult a SEBI-registered investment adviser before acting on any strategy.
Bollinger Bands are the envelope you often see wrapped around a price chart: a middle line with one band above and one below, widening when the market gets jumpy and narrowing when it goes quiet. They were developed by John Bollinger in the 1980s and remain a default overlay on most charting platforms used in India. This explainer covers how the bands are built from a 20-period moving average and two standard deviations, what the "squeeze" and "walking the bands" mean, and why a touch of a band is not a signal by itself.
What Bollinger Bands are
StockCharts ChartSchool describes Bollinger Bands as volatility bands placed above and below a moving average, with volatility measured by standard deviation. Because standard deviation rises and falls with volatility, the bands adapt automatically. That adaptiveness is the point: John Bollinger has explained on his own website that earlier fixed percentage bands had to be redrawn by hand as conditions changed, and he wanted a band that adjusted itself.
The bands answer one question: is price high or low relative to its own recent behaviour? They do not say whether price is high or low in any absolute or valuation sense.
How the bands are calculated
The standard settings are the ones Bollinger has used from the start:
- Middle band = 20-period simple moving average (SMA) of closing prices.
- Upper band = middle band + 2 × the 20-period standard deviation.
- Lower band = middle band − 2 × the 20-period standard deviation.
The standard deviation uses the same 20 closes as the average. Bollinger notes that he uses the population form of standard deviation (dividing by 20, not 19), so a spreadsheet using the sample formula will produce slightly wider bands.
Settings can be adjusted. ChartSchool reports that Bollinger suggests small changes to the multiplier when the period changes, for example about 2.1 standard deviations with a 50-period average and about 1.9 with a 10-period average.
Two companion measures
- %B shows where the latest close sits within the bands: (close − lower band) ÷ (upper band − lower band). A value of 1 means price is at the upper band, 0 at the lower band, and 0.5 at the middle. It can go above 1 or below 0.
- BandWidth measures how wide the bands are relative to the middle band: (upper − lower) ÷ middle. It is the usual tool for spotting a squeeze.
Worked example (hypothetical numbers)
Example only. These are imaginary daily closes for an imaginary stock, not real market data.
A trending 20-day window
Closes: 500, 502, 501, 504, 506, 505, 507, 509, 508, 510, 512, 511, 513, 515, 514, 516, 518, 517, 519, 521.
| Item | Calculation | Result |
|---|---|---|
| Middle band (20-SMA) | Sum of 20 closes ÷ 20 | 510.40 |
| Standard deviation (population) | From the same 20 closes | 6.08 |
| Upper band | 510.40 + 2 × 6.08 | 522.56 |
| Lower band | 510.40 − 2 × 6.08 | 498.24 |
| %B for the last close (521) | (521 − 498.24) ÷ (522.56 − 498.24) | 0.94 |
| BandWidth | (522.56 − 498.24) ÷ 510.40 | about 4.8% |
A %B of 0.94 tells you the last close is near the upper band. In this steadily rising series, that reflects strength. It is not, by itself, a sign that the stock has gone "too far".
A quiet 20-day window
Now imagine the same stock spends 20 sessions closing between 510 and 512. The middle band works out to 510.90 and the standard deviation to just 0.70, so the bands sit at 512.30 and 509.50. BandWidth shrinks to about 0.55%, less than an eighth of the trending example. That kind of contraction is what traders call a squeeze.
The squeeze
Volatility tends to move in cycles: quiet periods are often followed by more active ones, and vice versa. The Bollinger Band squeeze is built on that idea. When BandWidth falls to a low level relative to its own recent history, the bands are pinched tightly around price, which some traders read as a sign that a larger move may be coming.
The catch is that a squeeze says nothing about direction. Price can break out upward or downward, and an initial move out of a squeeze can reverse; this is sometimes called a "head fake". Traders who use the squeeze usually wait for price to close outside a band, and many look for confirmation from volume or another indicator.
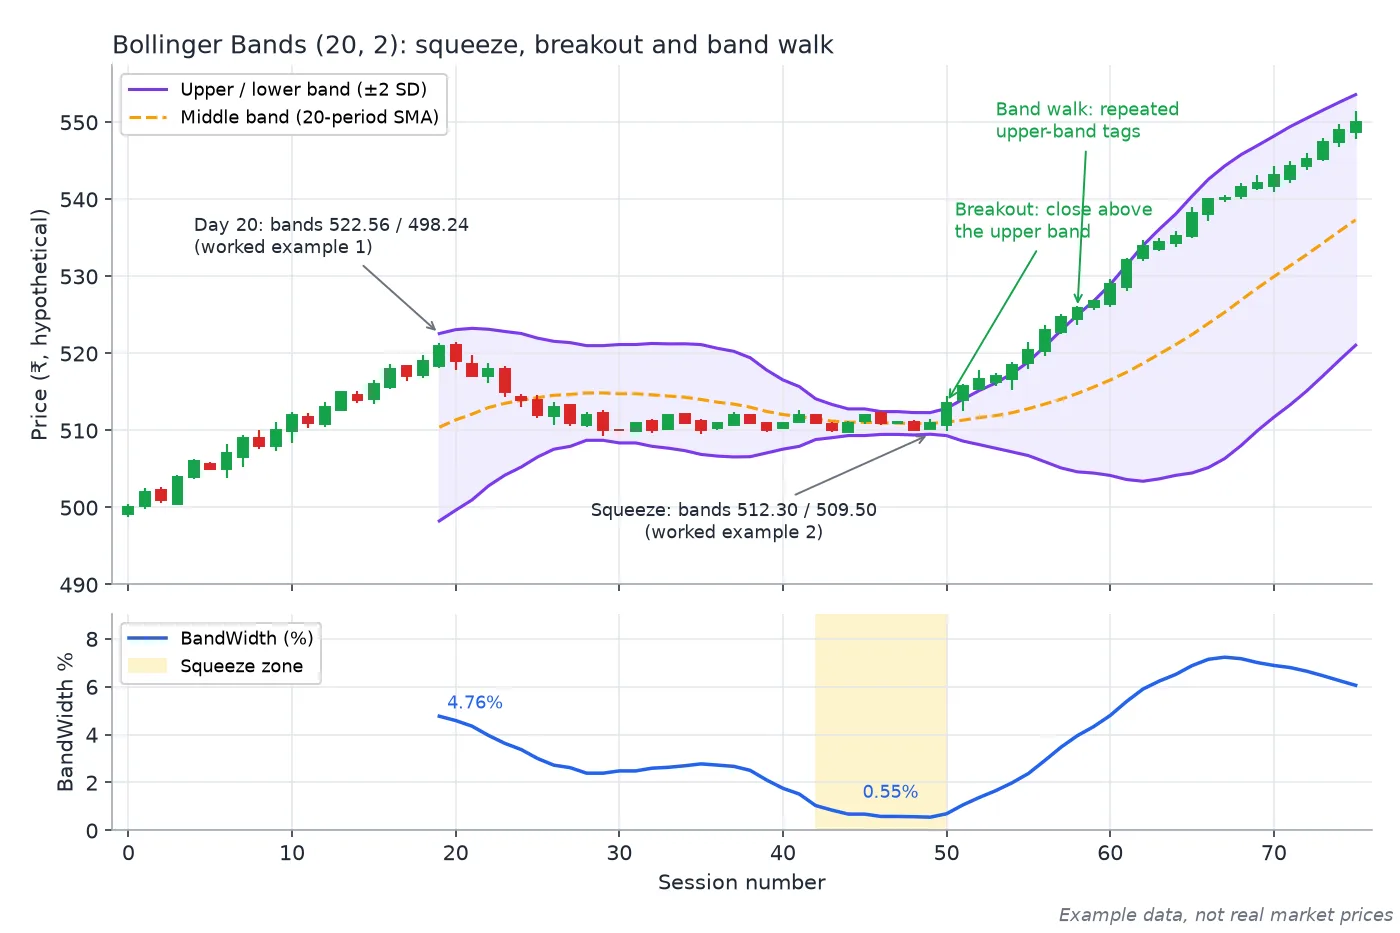
Both worked examples on one synthetic chart: bands of 522.56 / 498.24 at Day 20, a squeeze to 512.30 / 509.50 (BandWidth about 0.55%), then a breakout and a walk along the upper band. Example data, not real market prices.
Walking the bands
A common beginner mistake is to treat every touch of the upper band as a sell signal and every touch of the lower band as a buy signal. ChartSchool, summarising Bollinger, makes the opposite point: moves that touch or exceed the bands are not signals but "tags".
- In a strong uptrend, price can walk the upper band, tagging it again and again while the trend continues. In such phases, price may rarely reach the lower band, and the middle band sometimes acts as support.
- In a strong downtrend, price can walk the lower band in the same way.
This is similar to how RSI can stay overbought in a strong trend: a reading at an extreme often reflects strength or weakness rather than an imminent reversal. Bollinger's own published examples pair the bands with other tools, such as a volume indicator, rather than reading them alone, and ChartSchool shows them combined with a momentum oscillator. Trend-following overlays like Supertrend can also provide context on whether a market is trending or ranging.
Other common uses
- W-bottoms and M-tops. ChartSchool describes how Bollinger uses the bands to qualify these patterns. For example, a W-bottom where the second low is lower in price but holds above the lower band can suggest weakening selling pressure.
- Mean reversion in ranges. In a genuinely sideways market, moves to a band and back toward the middle can be more meaningful. The difficulty is knowing in advance whether a market will keep ranging.
Limits of Bollinger Bands
- Touches are not signals. As above, tags of a band reflect strength or weakness; acting on them alone is a common error.
- No direction from a squeeze. A squeeze suggests a bigger move may come, not which way.
- Lag. The bands are built on a moving average and past volatility, so they react after the fact.
- Statistics are approximate. Market returns are not perfectly "normal", so price closes outside the bands more often than textbook statistics would suggest. ChartSchool reports Bollinger's guidance that the bands should contain roughly 88–89% of price action.
- Settings and timeframes. A 20-period band on a 5-minute chart and on a daily chart describe very different things.
- No fundamentals or events. Results, policy decisions and global shocks can move price well outside any band.
Keep the base rate in mind as well: SEBI's September 2024 study found that 93% of individual equity F&O traders lost money between FY22 and FY24.
Key takeaways
- Middle band = 20-SMA; outer bands = ± 2 population standard deviations of the same 20 closes.
- %B shows where price sits within the bands; BandWidth shows how wide they are.
- A squeeze signals low volatility and possibly a bigger move ahead, but not its direction.
- Walking the bands is a feature of strong trends; band tags alone are not buy or sell signals.
Related reading on HorizonDesk
- Supertrend indicator explained: ATR, period, multiplier and trailing stops
- RSI explained: calculation, 70/30 levels and divergence
- Investing in equities in your 20s: making time your biggest asset
- Building your first investment portfolio: a beginner's framework
Sources
- StockCharts ChartSchool: Bollinger Bands
- John Bollinger: Bollinger Bands (bollingerbands.com)
- Investopedia: Bollinger Bands
- Investopedia: Standard deviation
- NSE: NCFM Technical Analysis Module
- SEBI press release (23 Sep 2024): 93% of individual F&O traders incurred losses, FY22–FY24
- SEBI Investor Website (investor education)