

An evergreen explainer for Indian retail readers. Last updated 24 October 2026.
Disclaimer: This article is for educational purposes only. It is not investment advice and not a recommendation to buy, sell or hold any security or derivative. HorizonDesk is not a SEBI-registered investment adviser or research analyst. Every number in the worked examples below is a hypothetical example, not real market data. Trading, particularly intraday and in futures and options, carries a high risk of loss. Please consult a SEBI-registered investment adviser before acting on any strategy.
Open almost any intraday trading discussion in India and you will see "CPR" mentioned alongside Nifty and Bank Nifty. The Central Pivot Range is a set of three price levels calculated before the market opens, using nothing more than the previous session's high, low and close. Traders use it to frame the day: where price might find support or resistance, and whether the session is more likely to trend or chop. This explainer covers the formulas, narrow versus wide CPR, the idea of a "virgin" CPR, how Indian intraday traders typically apply it, and its limits.
Where CPR comes from
CPR is an extension of classic pivot points. StockCharts ChartSchool explains that floor traders would take the previous day's high, low and close at the start of each session to calculate a pivot point, then derive support and resistance levels from it. Those levels stay fixed for the day.
The Central Pivot Range adds two more lines around the pivot to turn a single level into a zone. The approach was popularised by trader Frank Ochoa, notably in his book Secrets of a Pivot Boss, although similar ideas circulated among pivot traders before that.
The formulas: Pivot, BC and TC
Using the previous session's high (H), low (L) and close (C):
- Pivot (P) = (H + L + C) ÷ 3
- Bottom Central Pivot (BC) = (H + L) ÷ 2
- Top Central Pivot (TC) = (P − BC) + P, which is the same as 2P − BC
When the previous close is in the lower part of the day's range, the "TC" formula produces a value below BC. Charting tools then simply swap the labels so the higher number is shown as the top. The zone itself is identical either way.
Many traders also plot the standard floor-trader levels described by ChartSchool and Investopedia around the CPR:
- R1 = 2P − L and S1 = 2P − H
- R2 = P + (H − L) and S2 = P − (H − L)
Worked example (hypothetical numbers)
Example only. The figures below are invented round numbers for an imaginary index, chosen to make the arithmetic easy. They are not actual Nifty or Bank Nifty levels and should not be read as levels for any real session.
Assume the previous session's high = 20,300, low = 20,000 and close = 20,250.
| Level | Calculation | Result |
|---|---|---|
| Pivot (P) | (20,300 + 20,000 + 20,250) ÷ 3 | 20,183.33 |
| BC | (20,300 + 20,000) ÷ 2 | 20,150.00 |
| TC | 2 × 20,183.33 − 20,150 | 20,216.67 |
| CPR width | 20,216.67 − 20,150 | 66.67 points (about 0.33% of P) |
| R1 | 2 × 20,183.33 − 20,000 | 20,366.67 |
| S1 | 2 × 20,183.33 − 20,300 | 20,066.67 |
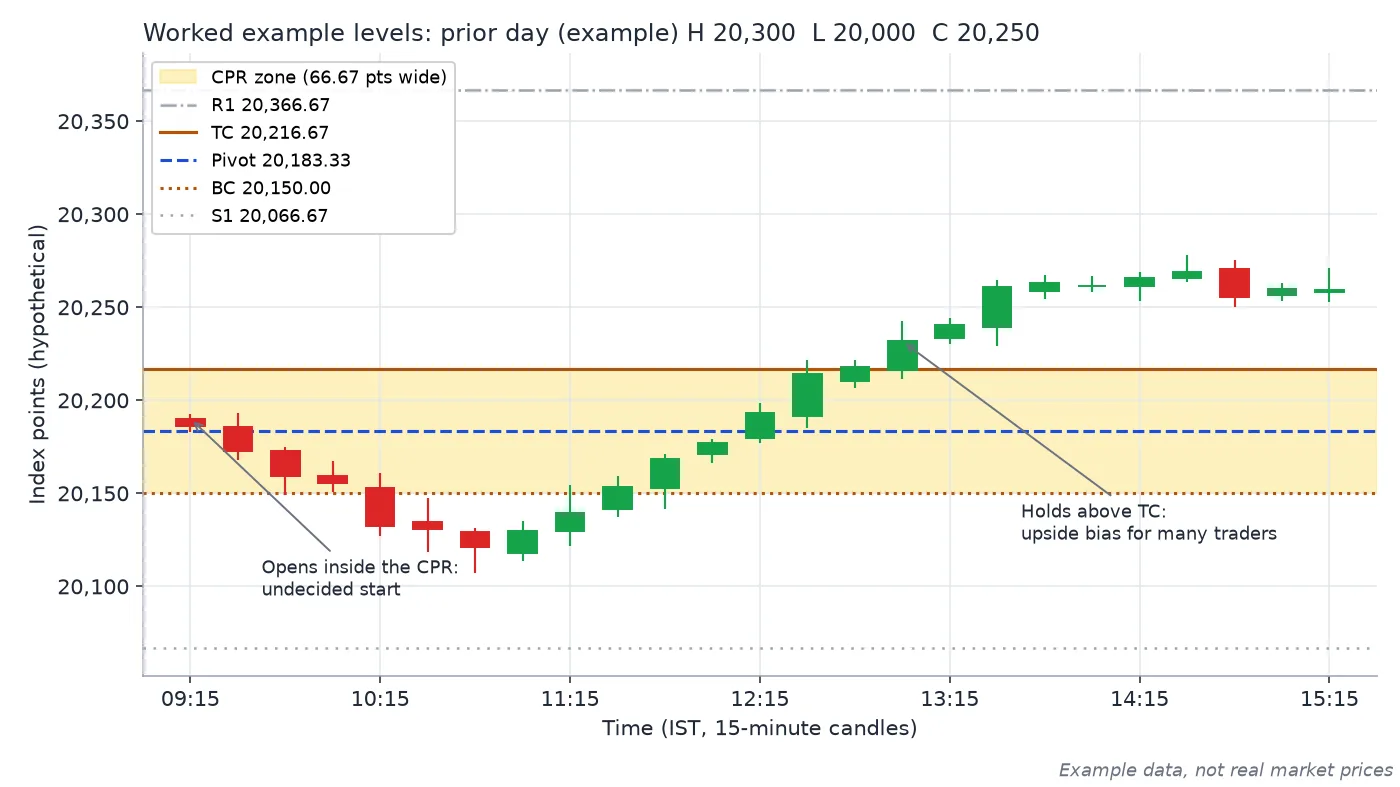
The worked example levels (prior day H 20,300, L 20,000, C 20,250) on synthetic 15-minute candles: the session opens inside the CPR, then moves above TC. Example data, not real market prices.
The label swap in action
Example only: suppose instead the previous session had high 20,400, low 20,000 and a weak close at 20,020. Then P = 20,140, BC = 20,200 and the formula gives "TC" = 20,080. Because 20,080 is below 20,200, it is displayed as the bottom of the zone, so the CPR runs from 20,080 to 20,200, a width of 120 points (about 0.6% of P).
Narrow CPR vs wide CPR
The width of the CPR depends on the previous day's range and on where the close sat within it. Traders read it as a rough guide to the coming session:
- Narrow CPR. Often follows a quiet, balanced day. Many traders treat it as a hint that the next session could trend, because the market has "coiled" and price may move away from the zone decisively. Example only: high 20,200, low 20,100 and close 20,160 give a CPR from 20,150.00 to 20,156.67, under 7 points wide.
- Wide CPR. Often follows a big-range day. Many traders treat it as a hint of a more sideways or range-bound session, with the zone acting as a wide area of indecision.
There is no official threshold for "narrow" or "wide". Traders usually compare today's width with recent sessions rather than using a fixed number of points, and Bank Nifty's larger point moves mean its CPR is usually wider in points than Nifty's. These tendencies are observations from practice, not rules, and plenty of narrow-CPR days stay sideways.
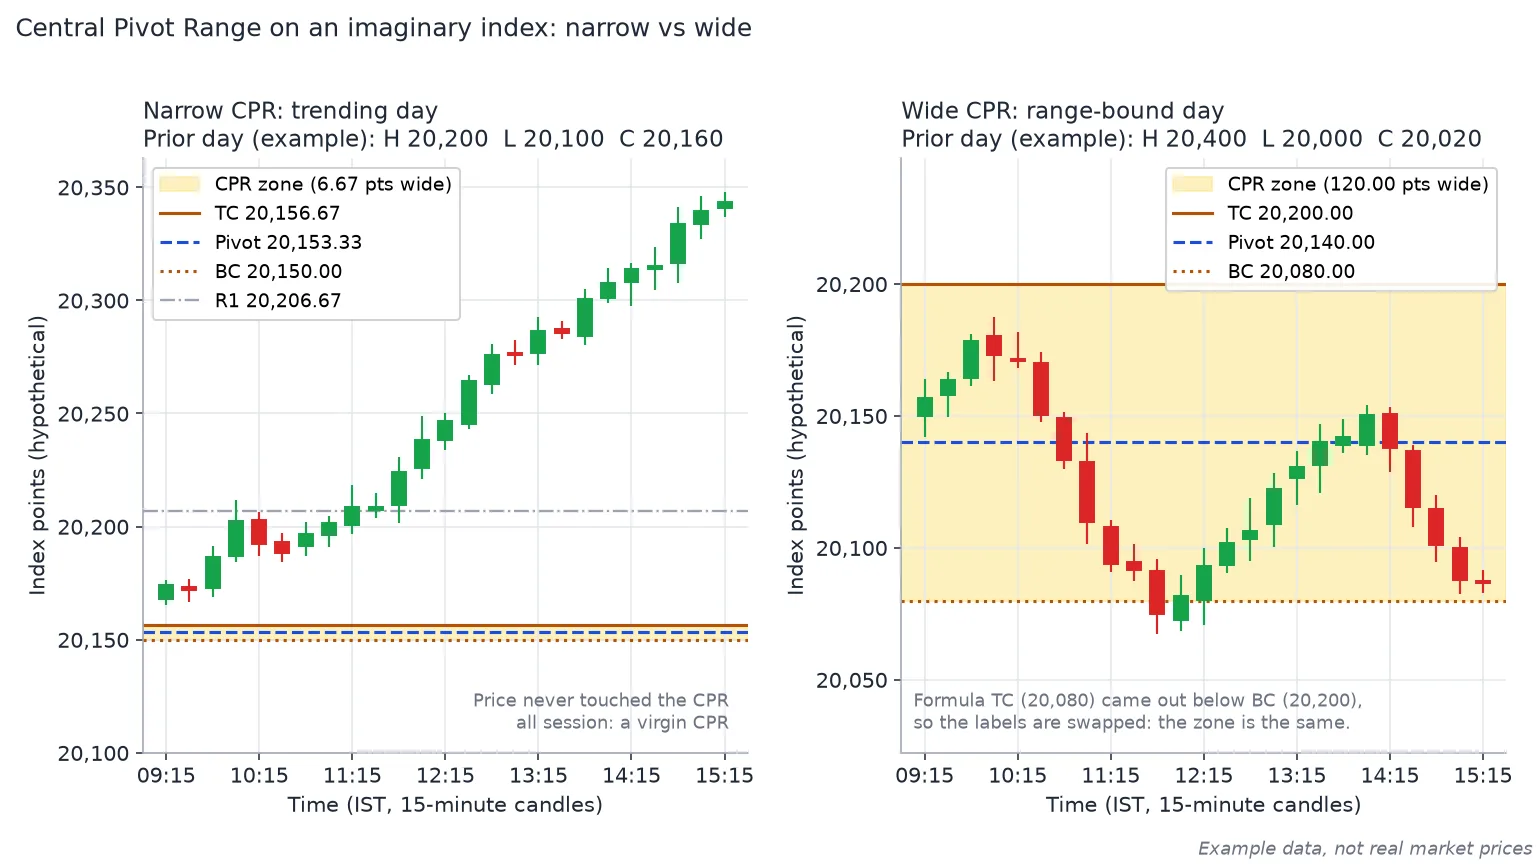
Narrow vs wide CPR on synthetic 15-minute candles. Left: prior day H 20,200, L 20,100, C 20,160 gives a 6.67-point CPR, and price trends away without touching it (also a virgin CPR). Right: prior day H 20,400, L 20,000, C 20,020 gives a 120-point CPR (labels swapped) and a range-bound session. Example data, not real market prices.
Virgin CPR
A virgin CPR is a CPR that price did not touch at all during the session: the whole day traded above it or below it. Some traders keep these untouched zones on their charts because they believe price may later return to test them, treating them as possible future support or resistance. This is a trading heuristic rather than a tested law, and an untested zone can stay untested for a long time.
How intraday traders in India use CPR with Nifty and Bank Nifty
NSE's equity cash session runs from 9:15 AM to 3:30 PM IST, and CPR for an index such as Nifty 50 or Nifty Bank is usually calculated from the previous session's high, low and close within that window. Common ways traders apply it include:
- Opening context. An open above the CPR is often read as a bullish tilt for the day, an open below it as bearish, and an open inside it as undecided.
- Support and resistance. The TC and BC lines, and the R1/S1 levels beyond them, are watched as areas where price may pause or reverse.
- Relationship to the previous CPR. A CPR placed entirely above the previous day's CPR is often read as a higher-value, bullish context; one entirely below as bearish; overlapping CPRs as sideways.
- Weekly and monthly CPR. The same formulas applied to the previous week's or month's high, low and close give longer-term zones, in line with how ChartSchool describes pivots on longer timeframes.
- Combining with other tools. Traders often pair CPR with a trend indicator such as Supertrend, a momentum gauge like RSI, or volatility context from Bollinger Bands, since CPR alone says nothing about momentum.
Note that index CPR levels are reference prices; trading the index itself happens through F&O contracts or ETFs, whose prices can differ from the spot index.
Limits of CPR
- It uses only three numbers. High, low and close ignore volume, intraday structure and anything that happened overnight.
- Gaps change everything. Global cues, results or policy news can open the market far from the CPR, making the levels much less relevant.
- Self-fulfilling, up to a point. Pivots may work partly because many traders watch them. That cuts both ways, since obvious levels can attract stop-hunting moves and false breaks.
- Narrow and wide are tendencies, not forecasts. A narrow CPR does not guarantee a trending day.
- Data differences. Using futures, spot or a different session's prices gives different levels.
- Intraday risk is high. SEBI's September 2024 study found that 93% of more than one crore individual equity F&O traders made losses between FY22 and FY24, averaging about ₹2 lakh per trader including costs.
Key takeaways
- P = (H + L + C) ÷ 3, BC = (H + L) ÷ 2, TC = 2P − BC, all from the previous session; swap labels if TC comes out below BC.
- Narrow CPR is often associated with trending days and wide CPR with range days, but neither is reliable on its own.
- A virgin CPR is one price never touched; some traders watch it as a possible future reference.
- CPR frames the day; it does not tell you what to trade, and it works best with risk management and context.
Related reading on HorizonDesk
- Supertrend indicator explained: ATR, period, multiplier and trailing stops
- RSI explained: calculation, 70/30 levels and divergence
- Bollinger Bands explained: squeeze, band walks and limits
- Market wrap: Sensex and Nifty's weekly fall on crude and FII selling
- Indian stock market in October 2026: RBI, FPI outflows and the rupee
Sources
- StockCharts ChartSchool: Pivot Points
- Investopedia: Pivot Point
- NSE: NCFM Technical Analysis Module
- NSE: Technical Analysis certificate programme
- SEBI press release (23 Sep 2024): 93% of individual F&O traders incurred losses, FY22–FY24
- SEBI Investor Website (investor education)
- Frank Ochoa, Secrets of a Pivot Boss (book), for background on the Central Pivot Range concept.