
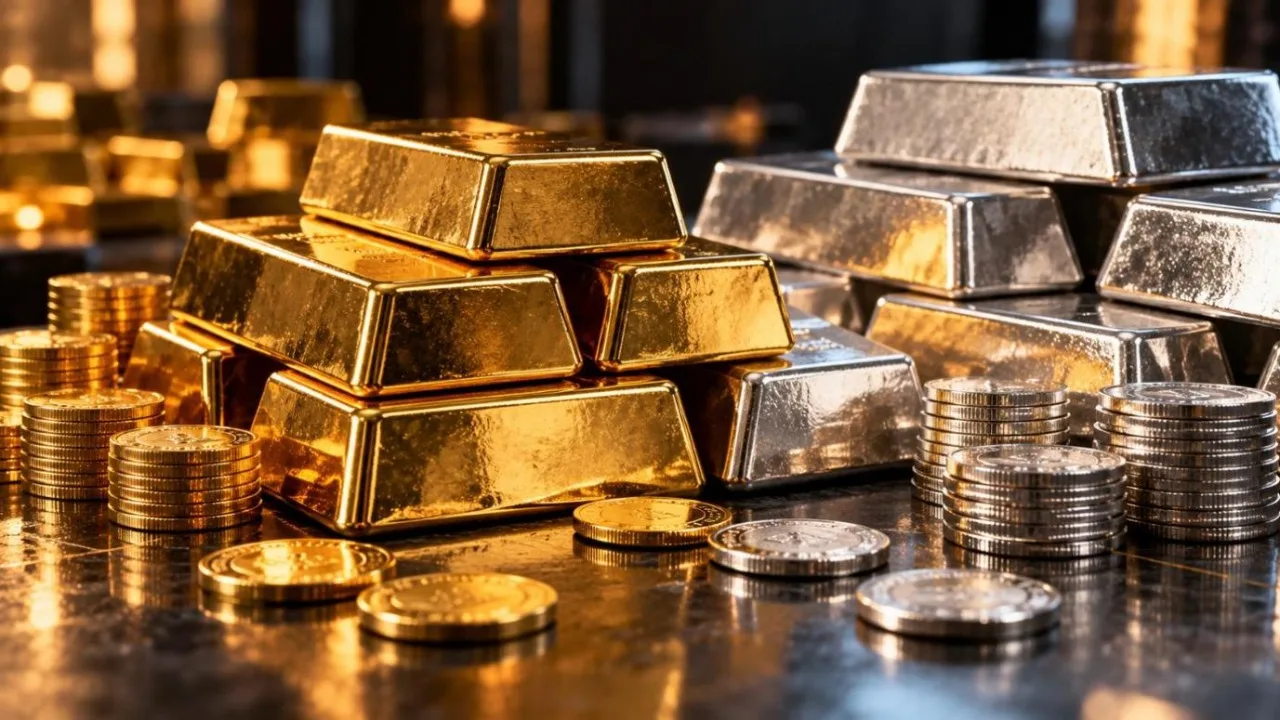
Gold and silver are having a difficult autumn. On Thursday, 22 October 2026, gold fell about 2% to around $4,050–4,060 an ounce, its lowest level since early August, while silver dropped more than 4% to about $55 an ounce, according to Trading Economics. Both metals are now far below the record highs they set in January.
This article explains where prices stand, why they are falling, what is still supporting them, and what banks and analysts expect next.
This article is for general information only and is not investment advice. Precious metal prices are volatile; check live prices before making any decision.
Prices at a glance
| Gold | Silver | |
|---|---|---|
| Price (22 Oct 2026) | About $4,050–4,060/oz | About $55.2–55.3/oz |
| Change on the day | About −2% | About −4.5% |
| Change over one month | About −5.5% | About −14% |
| Change over one year | About −2% | About +13% |
| Record high (January 2026) | $5,405 (LBMA benchmark, 29 Jan); about $5,608 intraday | About $121.6 |
| Distance from record | About 25% below | More than 50% below |
Sources: Trading Economics, World Gold Council. At these prices the gold-to-silver ratio, the number of ounces of silver it takes to buy one ounce of gold, is about 73.4.
Why prices are falling
1. Higher interest rates and bond yields
Gold pays no interest, so it becomes less attractive when bonds pay more. The US Federal Reserve raised rates by a quarter point in September, and markets now price more than an 85% chance of another rise in December, according to Trading Economics. The US 10-year Treasury yield is above 5%. State Street Investment Management noted that markets were pricing about 3.3 more Fed hikes over the next nine months at the end of September.
2. Oil and inflation
Renewed Houthi attacks on Saudi Arabia pushed Brent crude to about $111.9 a barrel on 22 October, its highest since May. Higher energy costs raise inflation fears, which in turn strengthen the case for tighter monetary policy. Hotter-than-expected US inflation data added to that pressure this week.
3. A stronger dollar and futures selling
In September, gold fell 8.5% as the dollar index rose about 2% and the 10-year yield jumped 53 basis points, according to the World Gold Council (WGC). Speculative investors in futures markets cut their positions sharply, worth about $12 billion, which the WGC says likely deepened the fall.
4. Silver's extra volatility
Silver tends to move further than gold in both directions because it is a smaller market and is also an industrial metal. After soaring to about $121 in January, it has more than halved. Its use in solar panels is also falling as manufacturers use less per panel; the Silver Institute cites a 19% drop and JPMorgan expects about 30%, according to MoneyMagpie.
What is still supporting gold
Despite the falling price, demand for gold as a long-term holding remains strong:
- Record ETF buying: global gold ETFs took in a record $31 billion in the third quarter, and holdings reached a record 4,256 tonnes, according to the WGC.
- Central banks: China's central bank bought 23 tonnes in September, its largest monthly purchase since October 2023, extending its buying streak to 23 months. Its official holdings now stand at 2,410 tonnes, the WGC reported.
- Chinese investors: Chinese gold ETF holdings hit a record 304 tonnes, and China's consumer gold imports reached a record 1,141 tonnes in the first eight months of 2026, according to State Street.
- Long-term worries: State Street lists record government debt, a gradual move away from the dollar, geopolitical risks and the possibility of a Fed policy error as structural reasons to hold gold.
For silver, the Silver Institute projects a sixth straight annual supply deficit in 2026, of 46.3 million ounces, and expects demand for coins and bars to rise 18%.
What analysts expect
Gold
| Forecaster | View | When made |
|---|---|---|
| State Street (base case, 60% probability) | $4,750–5,500 by end of Q1 2027 | October 2026 |
| State Street (bear case, 35% probability) | Stays in a $4,000–4,750 range for six to nine months | October 2026 |
| Bank of America | 2026 average of $4,360; $5,000 “still in reach” once Fed tightening ends | July 2026 |
| Morgan Stanley | $5,200 for the second half of 2026 (cut from $5,700) | April 2026 |
Note that several forecasts were made before September's sell-off, and banks have repeatedly revised their targets this year. With gold now near $4,050, it sits at the bottom of State Street's bear-case range.
Silver
| Forecaster | View |
|---|---|
| JPMorgan | $63 in Q4 2026; $63.90 average in 2027 |
| HSBC | $70 at end-2026; $65 at end-2027 |
| UBS | $70 by December 2026 |
Source: MoneyMagpie, October 2026. With silver near $55, all three sit above today's price, but they were published before this week's drop.
Key levels to watch
State Street's October report flagged gold's 50-day moving average (about $4,322) and 200-day moving average (about $4,539) as resistance, and $4,000 as the key psychological floor. Gold has already broken below support near $4,121. A sustained fall under $4,000 would likely be read as a further weakening of the trend; a recovery above the moving averages would suggest the sell-off is over.
Three scenarios for the months ahead
| Scenario | What would need to happen | Likely effect |
|---|---|---|
| Bearish | Fed keeps raising rates, oil stays high, dollar strengthens | Gold tests or breaks $4,000; silver falls further |
| Range-bound | Fed pauses but yields stay above 5% | Gold holds roughly $4,000–4,750, as in State Street’s bear case |
| Bullish | Fed signals the end of hikes, geopolitical shock or policy error, continued central bank buying | Gold recovers towards $4,750–5,500; silver rebounds sharply |
Dates to watch
- 27–28 October: Federal Reserve policy meeting.
- Next week: US PCE inflation data, the Fed's preferred inflation measure.
- Ongoing: Middle East tensions and oil prices; monthly central bank and ETF data from the World Gold Council.
What it means for investors
Gold's role in most portfolios is as a diversifier and long-term store of value, not a quick trade. Falls of this size have happened before during periods of rising interest rates. If you hold gold or silver, it may help to check whether your allocation still matches your plan rather than react to daily swings. Our guides on how much gold belongs in a portfolio and portfolio rebalancing explain the principles, and our earlier piece explains why gold started wobbling above $4,000.
Prices checked on 22 October 2026. This article is not financial advice; consider speaking to a qualified adviser before investing.
Sources
- Trading Economics: Gold price
- Trading Economics: Silver price
- World Gold Council: Gold market commentary, September 2026
- World Gold Council: China gold market update, Q3 2026
- State Street Investment Management: Monthly Gold Monitor, October 2026
- KuCoin News (WGC data): Global gold ETFs attract record $31 billion in Q3 2026
- MoneyMagpie: Silver price prediction October 2026
- MarketScreener: BofA cuts 2026 average gold forecast
- Mining.com: Morgan Stanley cuts gold price forecast
- Cornerstone Futures: Brent hits highest since May